 Buy Crypto
- Markets
 Futures
- Spot
- Copy Trade
- Earn
- More
Pump.fun Exceeds Market Expectations: December 10, 2025
Key Takeaways
- Pump.fun is currently trading 29.22% above its price prediction for December 15, 2025.
- The coin has experienced significant losses over the past month, dropping by 31.81%.
- Market sentiment for Pump.fun is bearish, with the Fear & Greed index indicating fear.
- Technical analysis highlights key support and resistance levels that could influence future price movements.
WEEX Crypto News, 2025-12-11 15:49:03
In the ever-volatile world of cryptocurrencies, few things are constant. One of these rare constants, however, is the unpredictability of asset prices, and Pump.fun is currently a testament to that fact. With its fluctuating price and a market sentiment that skews towards the bearish side, it presents an intriguing case of market dynamics at work. Despite being down 6.20% today against the US Dollar, Pump.fun is trading 29.22% above its predicted value for mid-December 2025. This peculiar situation raises questions about what drives such surprising market behavior and what factors play into these unexpected movements.
Pump.fun: A Troubled Month and Bear Market Sentiment
The current state of Pump.fun is that of mixed signals, making it a challenge for analysts and investors alike. Over the past month, Pump.fun has shown a clear downward trend, aligning with a broader bearish sentiment in the cryptocurrency market. It has registered a 31.81% drop over the last month alone, contributing to a significant 39.21% decrease from the previous year. These figures indicate a persistent bearish trend that has consistently plagued this digital currency.
However, the intrigue deepens when considering that Pump.fun is trading at $0.002974, exceeding the price prediction of $0.002301 for December 15, 2025. While this may initially appear positive, the broader market context paints a different picture. Sentiment remains bearish, indicated by the Fear & Greed index reading of 26, emblematic of prevailing market fear. Investors appear hesitant to engage, a sentiment that often aligns with potential buying opportunities but can also underline deep uncertainties about the market’s direction.
An Examination of Pump.fun’s Recent Performance
A closer look into Pump.fun’s price movements reveals an asset mired in volatility. Its all-time high was achieved on September 14, 2025, when it reached $0.008791. Since then, it has encountered significant hurdles, manifesting in substantial drops. The current cycle high stands at $0.003374, with a low at $0.002485, underscoring the extent of its fluctuating nature. High volatility has defined its market presence, with a 1-month volatility rate of 15.14, illustrating both opportunity and risk for investors.
This recent volatility comes against a backdrop of technical indicators that further complicate Pump.fun’s market position. Although there were 12 green days in the last 30-day period, the overall trend indicates more significant downward momentum. Current bearish technical indicators overwhelmingly dominate—13 indicators project further bearish trends in stark contrast to only four bullish forecasts.
Technical Analysis: Support and Resistance Levels
Technical analysis offers critical insights into Pump.fun’s market dynamics, particularly when it comes to support and resistance levels. With the asset currently trading under bearish sentiment, the most vital support levels to watch are around $0.002928, $0.002791, and $0.002647. Resistance levels, critical points that could inform future buying interest, are positioned at $0.003210, $0.003355, and $0.003492. These levels provide traders with key indicators on potential pivot points where price movements might shift course due to buying or selling pressures.
Analyzing Key Moving Averages
Pump.fun’s moving averages tell a complex story. For instance, short-term averages such as the MA3 and MA5 denote sell signals, implying negative momentum in the near term. Both the Daily Simple Moving Average (SMA) and the Daily Exponential Moving Average (EMA) underscore bearish trends, with longer-term sights indicating deeper entrenched bearish currents as Pump.fun trades below the MA50 and is influenced by broader market trends.
Looking at the Relative Strength Index (RSI 14), a technical indicator often used to assess overbought or oversold conditions, Pump.fun stands at 47.91, suggesting a neutral position not deeply entrenched in either extreme of the scale. Further, metrics like the Stochastic RSI and Commodity Channel Index hover in neutral zones, yet offer sell signals indicative of the complex dance between bullish and bearish pressures.
Oscillation Indicators: The Underlying Truths
As part of broader technical analysis, oscillators provide additional insight into Pump.fun’s performance. Indicators like the Awesome Oscillator and Momentum indicators also reflect neutrality, implying neither significant upward nor downward momentum. However, indicators such as the Stochastic RSI suggest potential sell signals, which could be used by market participants to adjust their portfolios in anticipation of further price corrections.
Market Sentiment: Navigating the Bearish Tide
Understanding Pump.fun’s place in the current market context requires a broader examination of sentiment. The prevailing fear as per the Fear & Greed Index signals investor reluctance, a potential precursor to lowered demand unless market forces can shift perceptions. Such indices reflect behavioral economics, where emotional responses to volatility directly influence trading activity.
Sentiments in crypto markets tread a fine line between fear and greed, each representing pivotal market entry or exit points. The current sentiment represents an environment where caution takes precedence, albeit a climate where opportunists might see potential buy-in points for future profit. This dichotomy showcases how seemingly contradictory aspects of market behavior coexist within the same time frame.
The Broader Market Canvas
Pump.fun’s journey is set against a wider tapestry of market movements. The cryptocurrency market’s dynamics have reached intriguing junctures, with the total market cap recording a 0.77% drop to $3.16T, and a notable BTC dominance decline to 58.44%. Notable pairings such as PUMP/BTC and PUMP/ETH highlight negative performance vis-a-vis larger counterparts, illustrating a broader pattern of underperformance.
These statistics contextualize Pump.fun’s challenges within an ebbing tide of market forces. The associated 24-hour trading volume dip of 9.57% further supports assertions of a quieter trading environment, where hesitance outweighs decisiveness.
Navigating Future Movements
Charting Pump.fun’s potential path forward requires cognizance of both its historical trends and prevailing forces at play. As investors contemplate future actions, the noise of high-beta assets such as Pump.fun demands attention to broader themes like macroeconomic indicators and sector-wide trends. Notably, intersections between cryptocurrencies and traditional assets, like the S&P 500 or gold, highlight cross-market influences that could indirectly sway crypto sentiment.
Moreover, taking stock of sentiment-driven metrics, like the Fear & Greed index—and aligning them with traditional technical analysis—offers avenues to strategize effectively. Each piece of data serves as a guidepost, enabling investors to discern more practical navigational bearings amidst a volatile sea.
Conclusion
Pump.fun’s adventure through the tempestuous realm of cryptocurrency markets encapsulates the dualities of opportunity and risk inherent to digital assets. Its current positioning above the anticipated mid-December price is not purely a cause for celebration but a complex reality requiring nuanced interpretation. As investors maneuver through bearish sentiment, understanding key factors like support and resistance levels, leveraging oscillator insights, and applying sentiment indices could offer pathways to optimize engagement with the market.
In an unpredictable landscape, Pump.fun represents a microcosm of the broader crypto spectacle—a domain where strategic acumen, tempered by robust analysis, remains paramount.
FAQs
What has contributed to Pump.fun’s current trading above predicted values?
Pump.fun’s current trading level, above its predicted value for December 2025, could be attributed to market anomalies where speculative trading inflates short-term prices beyond expected valuation levels. External market factors or an upsurge in speculative interest might also play roles.
Why is the sentiment on Pump.fun currently bearish?
The bearish sentiment surrounding Pump.fun is largely due to its recent performance, marked by significant price declines alongside broader market conditions that exhibit investor fear, as indicated by the Fear & Greed Index. Such sentiments reflect caution amid volatile conditions.
What do we mean by ‘support’ and ‘resistance’ levels in cryptocurrency trading?
Key support levels are price points where a cryptocurrency might find support as it falls, indicating potential buying interest, whereas resistance levels are points where selling interest might overpower buyers, potentially stalling or reversing upward trends.
Are there potential buy signals for Pump.fun?
While some technical indicators provide buy signals, such as the VWMA and Hull Moving Average, investors should approach cautiously due to overarching bearish sentiment. Paying attention to comprehensive market indicators helps assess larger trends.
How does the Fear & Greed Index influence market perceptions?
The Fear & Greed Index serves as a sentiment measure, with ‘fear’ often indicating pessimism, possibly hinting at buying opportunities, while ‘greed’ signals market optimism that might suggest overvaluation. Its readings can influence timing decisions in trading activities.
You may also like

After two years, Hong Kong's first batch of stablecoin licenses finally issued: HSBC, Standard Chartered make the cut

The person who helped TAO rise by 90% has now single-handedly crashed the price again today

3-Minute Guide to Participating in the SpaceX IPO on Bitget

Top 5 Cryptos to Buy in 2026 Q1: A ChatGPT Deep Dive Analysis
Explore the top 5 cryptos to buy in Q1 2026 including BTC, ETH, SOL, TAO, and ONDO. See price outlooks, key narratives, and institutional catalysts shaping the next market move.

How to Earn $15,000 with Idle USDT Before Altcoin Season 2026
Wondering if altcoin season is coming in 2026? Get the latest market update, and learn how to turn your idle stablecoins waiting for entry into extra rewards up to 15,000 USDT.
Can You Win Joker Returns Without Large Trading Volume? 5 Mistakes New Players Make In WEEX Joker Returns Season 2
Can small traders win WEEX Joker Returns 2026 without huge volume? Yes—if you avoid these 5 costly mistakes. Learn how to maximize card draws, use Jokers wisely, and turn small deposits into 15,000 USDT rewards.

Altcoin Season 2026: 4 Stages to Profit (Before the Crowd FOMO In)
Altcoin Season 2026 is starting — discover the 4 key stages of capital rotation (from ETH to PEPE) and how to position before the peak. Learn which tokens will lead each phase and avoid missing the rally.

Will Alt season come in 2026? 5 Tips to Spot the Next 100x Crypto Opportunities
Will altcoin season arrive in 2026? Discover 5 rotation stages, early signals smart traders watch, and the key crypto sectors where the next 100x altcoin opportunities may emerge.

The bear market has arrived, and cryptocurrency ETF issuers are also getting involved

The richest man had a quarrel with his former boss
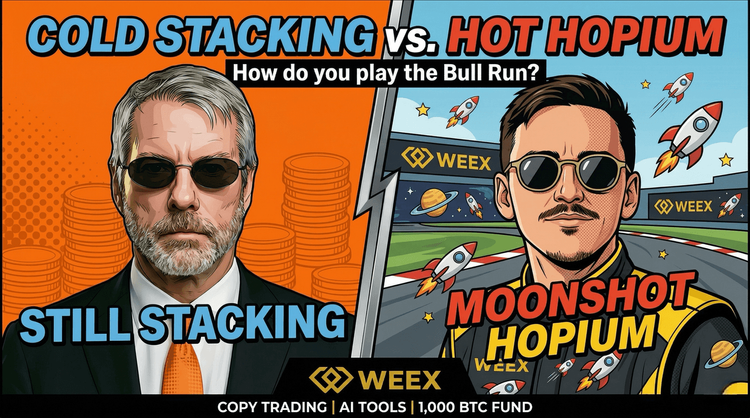
BTC Firm Above 70K! Saylor’s "Institutional Logic" vs. Moon’s "Retail Faith": Who is Really Harvesting the Market?
Bitcoin is holding firm above the $70,000 support level following a massive short squeeze that liquidated $427 million. As the "Four-Year Cycle" narrative shifts, the market is split: Michael Saylor’s cold, institutional "indiscriminate stacking" vs. Carl Moon’s high-energy retail "hopium." This article decodes these two polar-opposite strategies for the 2026 bull run and reveals how WEEX’s institutional-grade liquidity and AI trading tools empower every type of investor to convert market volatility into profit.

The Girl Who Created the SBTI Test: A Story of a Doomed Cyber Love, an E-Widow Ratfolk

B.AI Officially Launched: Building AI Agent Financial Bedrock Platform, Driving AGI Era Business Underlying Logic

B.AI Officially Launched: Breaking Down A2A Collaboration Barriers to Unlock the Smart Body Economy's Full Potential
We helped Xu Mingxing write a book called "<OK Life>".

Rare APY of 400%, is TradeXYZ handing out money to oil bulls?
a16z: Perpetual Contracts are Rewriting Global Trading Rules

Bitcoin Hits $73,000 Triggering $427M Short Liquidation | Carl Moon: $200,000 is the Target
April 9, 2026 (UTC+0), 22:17. Bitcoin (BTC) executed a high-velocity surge within minutes, heavy-hitting the $73,000 psychological barrier and touching a local high near $74,000. While the price has since retraced to consolidate above $72,000, this "instant ambush" successfully completed a $427M liquidation of short positions.
After two years, Hong Kong's first batch of stablecoin licenses finally issued: HSBC, Standard Chartered make the cut
The person who helped TAO rise by 90% has now single-handedly crashed the price again today
3-Minute Guide to Participating in the SpaceX IPO on Bitget
Top 5 Cryptos to Buy in 2026 Q1: A ChatGPT Deep Dive Analysis
Explore the top 5 cryptos to buy in Q1 2026 including BTC, ETH, SOL, TAO, and ONDO. See price outlooks, key narratives, and institutional catalysts shaping the next market move.
How to Earn $15,000 with Idle USDT Before Altcoin Season 2026
Wondering if altcoin season is coming in 2026? Get the latest market update, and learn how to turn your idle stablecoins waiting for entry into extra rewards up to 15,000 USDT.
Can You Win Joker Returns Without Large Trading Volume? 5 Mistakes New Players Make In WEEX Joker Returns Season 2
Can small traders win WEEX Joker Returns 2026 without huge volume? Yes—if you avoid these 5 costly mistakes. Learn how to maximize card draws, use Jokers wisely, and turn small deposits into 15,000 USDT rewards.